What the Public Data Can and Cannot Tell Us About SELLAS’s Galinpepimut-S in AML
A fact-based analysis of the Phase 3 REGAL trial, built from public sources: ClinicalTrials.gov, PubMed, and SELLAS Life Sciences press releases read from primary text. Snapshot: verified through the May 2026 REGAL update. This is a methodological/statistical assessment of publicly available information — not investment advice, and not medical guidance.
Summary
Galinpepimut-S (GPS) is a WT1-targeting peptide cancer vaccine whose pivotal test is REGAL, a Phase 3 trial in acute myeloid leukemia (AML) patients in second complete remission (CR2). As of the most recent public update the trial remains blinded and has not reported arm-level survival data. Working only from the aggregate (pooled, both-arms-combined) death counts the company has disclosed — 60, 72, and 78 events at three dated timepoints — this analysis reaches one robust conclusion and several conditional ones.
The robust conclusion: the publicly disclosed event accrual has been materially slower than the sponsor’s own earlier event-timing forecasts (SELLAS had guided to 60 events around 2023–24 and 80 events by end-2024; in reality 60 events came in December 2024 and only 78 by May 2026). This is at least consistent with better aggregate survival than originally expected, which would be encouraging at the pooled-population level — but by itself it says nothing about which arm any benefit accrues to. Pooled, blinded counts do not identify the hazard ratio, either arm’s median, or the shape of the survival curve without strong modelling assumptions.
The conditional findings (each dependent on an explicit enrollment/censoring/survival-distribution model, not read directly from data):
- A declining-hazard (Weibull shape < 1) model fits the three disclosed milestones better than a constant-hazard comparator — but a constant hazard in a closed cohort also produces slowing monthly counts, so this is a model-fit preference, not a demonstrated property.
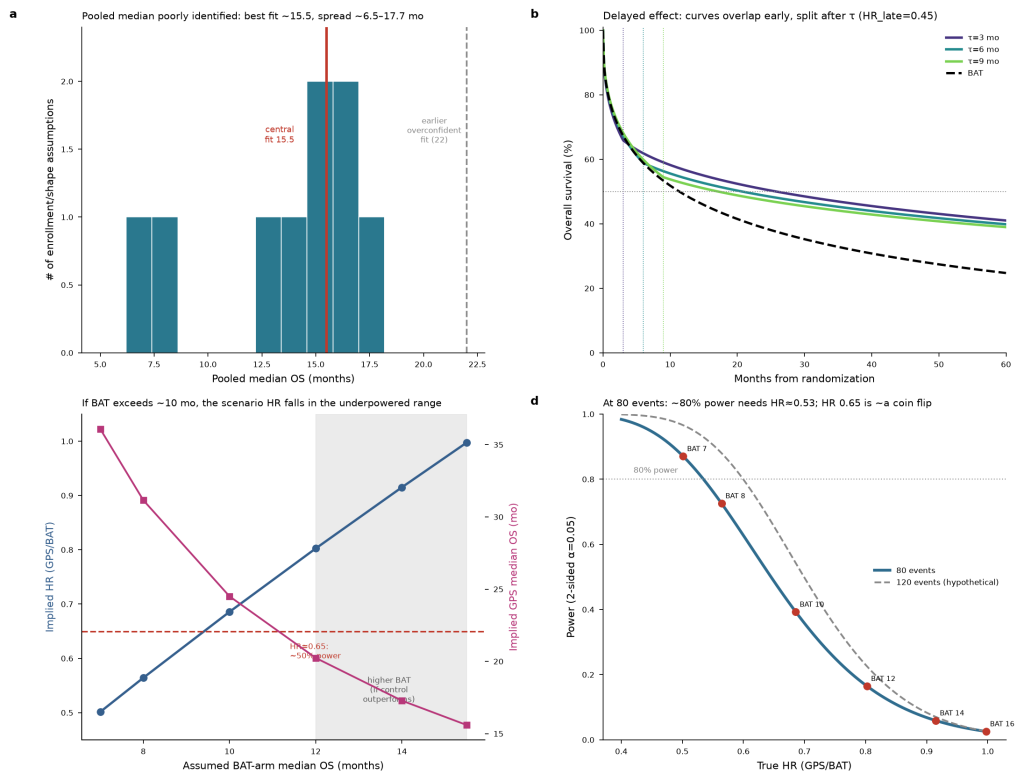
- The pooled median OS is poorly identified: the best-fitting model gives ~15.5 months, but point estimates span ~6.5–17.7 months across assumptions. SELLAS’s own blinded readout “suggested” a pooled median exceeding 12 months.
- The sponsor’s 8-month control-arm assumption may be pessimistic, but the public data do not establish a specific alternative (e.g. 12–15 months).
- At the planned 80 events, the trial has power to detect only a large effect: an observed HR near 0.64 is roughly the significance boundary, and ~80% power requires a true HR around 0.53.
The safety profile has been consistently favorable across the program. Efficacy remains unproven: no completed, adequately-powered randomized trial has yet demonstrated a statistically significant survival benefit for GPS.
1. The molecule and the development program
Galinpepimut-S is a tetravalent, non-HLA-restricted, heteroclitic WT1 peptide vaccine, administered with the Montanide adjuvant and GM-CSF. WT1 (Wilms’ tumor 1) was ranked a top immunotherapy target in a National Cancer Institute prioritization study, which is the scientific rationale for the program. The molecule originated at Memorial Sloan Kettering and was licensed by SELLAS.
Search strategy. A ClinicalTrials.gov API v2 query for “galinpepimut OR galinpepimut-S” (run for this analysis) returned seven registered studies sponsored by SELLAS or MSK. This count is specific to that query term and date; earlier GPS studies referenced in company materials (including the AML CR2 Phase 1/2 study first reported by Brayer et al., Am J Hematol 2015, with SELLAS follow-up data in 2020) may not surface under that exact search string, so “seven” is a query result, not an exhaustive census of every GPS study ever run.
| NCT | Trial | Phase | Design | Status | n | Indication |
|---|---|---|---|---|---|---|
| NCT04229979 | REGAL (pivotal) | 3 | Randomized, open-label | Active, not recruiting | 127 | AML, CR2 |
| NCT03761914 | GPS + pembrolizumab | 1/2 | Non-randomized basket | Completed | 26 | Multiple solid tumors + AML |
| NCT04040231 | GPS + nivolumab (MSK) | 1 | Single-arm | Completed | 10 | Mesothelioma |
| NCT01827137 | GPS multiple myeloma | 1/2 | Single-arm | Completed | 20 | MM post-transplant |
| NCT01266083 | GPS AML remission | 2 | Single-arm | Completed | 22 | AML (CR1) |
| NCT01265433 | GPS mesothelioma | 2 | Randomized, double-blind | Completed | 41 | Pleural mesothelioma |
| NCT05593185 | Expanded Access | — | — | Available | — | AML/MDS |
Two features stand out. First, the evidence base underpinning a Phase 3 program is thin: most trials are small (n = 10–41) and single-arm, and a PubMed search for “galinpepimut-S” (same date) indexed only six peer-reviewed articles. Second, among the seven studies returned by this search, only two are randomized — the 41-patient mesothelioma Phase 2 and REGAL itself.
2. The supporting early-phase data
AML Phase 2, CR1 (NCT01266083, n=22; Blood Advances 2018). Single-arm, no control. Median disease-free survival from CR1 was 16.9 months; OS from diagnosis was not reached and estimated at ≥67.6 months; 64% of tested patients showed a WT1-specific immune response. Frequently cited as rationale for REGAL, but the single-arm design and the selected CR1 population make it vulnerable to selection and immortal-time bias, and it is a different remission setting (CR1) from REGAL (CR2).
AML Phase 1/2, CR2 (Brayer et al., Am J Hematol 2015; SELLAS follow-up 2020; the “21 vs 5.4 months” comparison). This is the study the sponsor most often cites for REGAL’s exact population. In the 2020 follow-up (median follow-up 30.8 months), GPS-treated CR2 patients had a median overall survival of 21.0 months versus 5.4 months for the comparator group (p < 0.02). The efficacy cohort was small — on the order of ten evaluable GPS-treated CR2 patients set against roughly fifteen retrospectively matched, contemporaneously treated comparators. It is a small single-arm cohort with a post-hoc matched, contemporaneously-treated comparator constructed retrospectively — not a randomized concurrent control. The 21-month figure is therefore vulnerable to selection into the treated cohort, retrospective comparator construction, and eligibility and follow-up differences; “contemporaneously treated” is not an internal randomized control arm. But the critique must attach to the right dataset: this is CR2 data in REGAL’s own setting, not the CR1 n=22 study.
Mesothelioma Phase 2 RCT (NCT01265433, n=41; 2017). The only randomized early trial. GPS vs. control: 1-year PFS 44% vs. 33%; median PFS 10.1 vs. 7.4 months; median OS 22.8 vs. 18.3 months. Explicitly not powered for between-arm comparison; the control arm closed early on a futility rule (causing unblinding); confidence intervals overlap. The PFS signal in particular is modest. A larger confirmatory mesothelioma trial was never launched.
Checkpoint-inhibitor combinations (NCT03761914, n=26; NCT04040231, n=10). Small early-phase safety/immunogenicity studies; not confirmatory efficacy evidence.
3. The pivotal trial: REGAL (NCT04229979)
REGAL is a randomized (1:1), open-label, parallel-group Phase 3 trial. GPS maintenance is compared against investigator’s choice of best available therapy (BAT — observation with palliative hydroxyurea permitted, azacitidine or decitabine, venetoclax, or low-dose cytarabine) in AML patients in CR2 who are ineligible for allogeneic stem-cell transplant. The primary endpoint is overall survival, and the design is event-driven: the final analysis triggers at 80 deaths.
Two design features warrant emphasis. The trial is open-label (no masking), defensible for an objective endpoint like OS but still able to influence subsequent lines of therapy. And the control is a heterogeneous “investigator’s choice” rather than a single defined regimen.
The verified public anchors
| Date | Pooled events (deaths) | Approx. calendar months from Feb 2021 study start | Source |
|---|---|---|---|
| Interim data cut (~late 2024) | 60 | ~46 | GlobeNewswire, 23 Jan 2025 |
| 26 Dec 2025 | 72 | ~58.7 | SELLAS IR, 29 Dec 2025 |
| 11 May 2026 | 78 | ~63.1 | SELLAS Q1 2026 update |
| trigger | 80 | — | protocol (final analysis) |
What the January 2025 interim actually said
The interim analysis (triggered by 60 deaths) was a combined futility, efficacy, and safety analysis. The Independent Data Monitoring Committee reviewed unblinded data and reported that GPS cleared the predetermined futility criterion, found no safety concerns, and recommended continuation without modification. This is the precise wording, and it matters: the trial landed in the continuation region — it was not stopped for futility, for safety, or for overwhelming early efficacy. The IDMC did not disclose that an early efficacy boundary had been crossed, and no hazard ratio, p-value, or arm-level figure was released.
The company separately reported two blinded, pooled quantities: a median follow-up of 13.5 months, and a statement that with fewer than 50% of the 127 patients deceased, the data “suggested” a pooled median OS exceeding 12 months — versus a historical ~6 months for CR2 patients on conventional therapy. It also reported that 80% of randomly selected GPS patients showed a specific T-cell immune response. Note that the release used inconsistent survival framing: its headline language implied median survival above 13.5 months, while the underlying blinded discussion was more cautiously described as suggesting pooled median OS above 12 months — which is why this analysis uses the more conservative 12-month figure.
How company framing can mislead
- “Positive interim” means the trial cleared futility and was allowed to continue — not that superiority was demonstrated. No efficacy boundary crossing was disclosed.
- The survival framing is a lower bound built on a blinded, pooled estimate vs. a historical control — not the trial’s own control arm, and not a confirmed Kaplan–Meier median. With staggered enrollment and censoring, “fewer than half have died at 13.5 months’ follow-up” does not by itself establish a KM median above 13.5 months.
- Immunogenicity is a biomarker, not clinical benefit. An 80% T-cell response rate does not translate directly into a survival advantage.
4. What the aggregate event counts imply — and what they don’t
Everything below back-calculates from the three pooled anchors under explicit modelling assumptions (a reconstructed Beta enrollment distribution calibrated to the 13.5-month median follow-up, plus a parametric survival family). Every number is conditional on those assumptions; none is a measured arm result.
4.1 The accrual is slow; a declining hazard fits better, but is not proven
Cumulative events (60 → 72 → 78) accrue at roughly 1 death per month on average. A constant-hazard (exponential) model matched to 60 events at month 46 predicts ~89 events by month 63 — but only 78 occurred. Under the reconstructed enrollment and censoring, a Weibull model with shape parameter below 1 fits the three milestones better than that exponential comparator.
The important caveat: a slowing monthly count is not proof that the individual-level hazard falls over time. In a closed or nearly closed cohort — with differing follow-up times, administrative censoring, loss to follow-up, and a shrinking risk set — monthly event counts can decline naturally even under a constant individual-level hazard because the at-risk set shrinks. So 60 → 72 → 78 is consistent with a declining hazard but does not establish it. The fitted shape (a value below 1, near 0.6 in the best fit) is the optimal parameter of the selected model under the selected assumptions — not the trial’s “true” hazard shape, and not estimable to two-decimal precision from three pooled points.
Likewise, a cure/plateau-fraction model fitted that fraction to 0.00. This means only that a cured subgroup is not needed to improve this particular fit — it does not demonstrate the absence of long-term survivors. Three pooled points cannot reliably distinguish a low late hazard, a small cure fraction, patient heterogeneity, or a log-normal vs. Weibull survival shape.
4.2 The pooled median is poorly identified
Fixing the interim median follow-up at 13.5 months, the best-fitting models (lowest residual) place the pooled median OS at ~15–16 months (central fit 15.5). Across models fitted only to the three event milestones, point estimates ranged from ~6.5 to ~17.7 months. However, models below roughly 12 months conflict with SELLAS’s separate blinded statement that the pooled median OS was estimated to exceed 12 months — so they should not be treated as equally plausible once all disclosed information is considered. Combining both sources, a pooled median somewhere in approximately the 13–17 month range is a defensible working estimate. Either way, aggregate counts do not pin the value precisely; 15.5 is a best guess, not a fixed number, and under the null (HR = 1) both arms can sit near it — the data do not force them apart.
4.3 Conditional arm-level scenarios
The pooled curve can be split into arms only under assumptions — a common Weibull shape and proportional hazards. The table below shows conditional scenarios consistent with the selected pooled model (central pooled ~15.5 months) for a range of hazard ratios. The HR is a free, unknown parameter; the pooled data do not “force” any particular value.
| HR (GPS/BAT) | BAT median OS (mo) | GPS median OS (mo) |
|---|---|---|
| 1.00 (null) | 15.5 | 15.5 |
| 0.85 | 12.8 | 18.9 |
| 0.75 | 11.1 | 22.0 |
| 0.65 | 9.4 | 26.2 |
| 0.55 | 7.8 | 32.2 |
4.4 A delayed treatment effect would be even harder to detect
Vaccines often separate only after a delay (τ), once an immune response matures. Modelling GPS = BAT until month τ, then hazard × HR_late:
| τ (mo) | HR_late | BAT median (mo) | GPS median (mo) | Median gain |
|---|---|---|---|---|
| 3 | 0.45 | 10.1 | 25.8 | +15.7 |
| 6 | 0.45 | 11.3 | 20.7 | +9.4 |
| 9 | 0.45 | 12.3 | 17.1 | +4.8 |
The later separation begins, the smaller the median gain for the same late hazard ratio. And the standard log-rank test does not preferentially up-weight the later events at which a delayed vaccine effect emerges, so it loses power against this pattern at a low event count.
5. Two skeptical inferences supported by the public record — and their limits
The 8-month control assumption may be pessimistic. The ~8-month figure (and the historical 6 months) describe non-transplanted, standard-therapy CR2 patients. REGAL’s control arm is a randomized, trial-eligible CR2 population receiving best available therapy — plausibly a more actively-treated group. But the public data do not establish that the actual REGAL control median is 12–15 months. Counter-pressures cut the other way: CR2 is itself a high-risk state, these patients are ineligible for transplant, BAT is heterogeneous and can include observation, and eligibility does not guarantee durable remission. The honest statement is that 8 months may be too low — not that a specific higher value is proven.
The “21 vs 5.4 months” comparison is weak — for the right reasons. It is CR2 data in REGAL’s setting (correcting an earlier misattribution to the CR1 study), but the 5.4-month comparator was a post-hoc matched, non-randomized group. The small sample, retrospective comparator construction, treatment-entry selection, and possible eligibility and follow-up differences can all exaggerate the apparent contrast. “Contemporaneously treated” is not an internal randomized control. The comparison is hypothesis-generating, not confirmatory.
6. The decisive tension: power at 80 events
For each assumed BAT median, the selected pooled model implies a scenario-consistent HR and GPS median. Pairing those with log-rank power (Schoenfeld approximation, two-sided α = 0.05):
| Assumed BAT median (mo) | Scenario HR (GPS/BAT) | Scenario GPS median (mo) | Power at 80 events |
|---|---|---|---|
| 7 | 0.50 | 36.1 | ~87% |
| 8 | 0.56 | 31.2 | ~74% |
| 10 | 0.69 | 24.5 | ~39% |
| 12 | 0.80 | 20.2 | ~16% |
| 14 | 0.92 | 17.3 | ~7% |
| 15.5 | 1.00 | 15.6 | ~5% (= type-I error) |
Power is a probability, not a verdict: a scenario with ~74% power still fails ~26% of the time even if that true effect exists. The key reference points, under this standard approximation:
- Ignoring or approximating the interim alpha spend, the critical observed HR for significance at 80 events is roughly 0.64 — close to SELLAS’s own stated significance target (~0.636, corresponding to design medians of about 12.6 vs. 8.0 months). Because some alpha was spent at the interim, the true final-analysis boundary may be slightly stronger.
- Achieving ~80% power requires a true HR around 0.53; ~90% power requires around 0.48.
- A true HR of 0.65 gives only ~49% power — a coin flip, not a reliable detection.
The exact final boundary depends on the statistical analysis plan (alpha spending across the interim, stratification, one- vs. two-sided testing), so these are approximations. But the direction is unambiguous: 80 events give the trial power to detect only a large effect. If the control arm substantially outperforms the sponsor’s 8-month assumption, GPS would need a correspondingly longer survival to produce a hazard ratio in the detectable range. The probability of a significant result is therefore highly sensitive to how the control arm performs — a variable the company’s public framing has arguably modelled optimistically (in GPS’s favor) by assuming a poor control.
7. Assumptions and limitations
- The enrollment distribution is modelled (Beta, accrual complete ~month 37) and calibrated to reproduce the 13.5-month median follow-up at month 46; a different true distribution shifts the event times and every downstream number.
- A single Weibull shape and proportional hazards across arms is a simplification; real curves can cross, and the delayed-effect case is modelled separately.
- All figures derive from pooled, blinded data — there is not a single arm-level observation. The HR is a free parameter, not an estimate.
- Medians are point estimates without confidence intervals; in a real n=127 dataset the intervals would be wide.
- Reported milestone dates are company disclosure dates, which may not coincide exactly with event-registration dates.
8. Conclusion
The defensible core thesis: the publicly disclosed event accrual has been materially slower than the sponsor’s earlier public forecasts, and appears slower than the original design assumptions would have suggested. It does not identify the pooled hazard’s shape, either arm’s median, or the treatment hazard ratio without strong assumptions about enrollment, censoring, and the survival distribution. The 8-month BAT assumption may be pessimistic, but a 12–15-month control median is not established by public data. The slow accrual is potentially encouraging at the pooled-population level — but it is not, by itself, evidence that GPS works.
The design gives the trial power to detect only a large effect at 80 events, and the probability of a significant result is highly sensitive to control-arm survival. The consistently favorable safety profile is the program’s most robust finding; a definitive efficacy verdict must await the arm-level, peer-reviewed final analysis.
Sources
- ClinicalTrials.gov API v2 — query “galinpepimut OR galinpepimut-S”; seven registered studies (design, enrollment, posted results).
- PubMed — query “galinpepimut-S”; six articles (PMIDs 28972039, 29386195, 34053383, 36900251, 39606837, 39802820).
- Peer-reviewed CR2 data — Brayer et al., Am J Hematol 2015 (initial cohort); SELLAS follow-up disclosure Feb 2020 (21.0 vs 5.4 months, median follow-up 30.8 mo, p < 0.02).
- SELLAS Life Sciences disclosures, read from primary text: GlobeNewswire (23 Jan 2025, interim analysis — 60 events, “exceeded predetermined futility criteria,” continuation without modification); SELLAS IR (29 Dec 2025 — 72 events as of 26 Dec 2025; IDMC recommendation Aug 2025); SELLAS Q1 2026 update (78 events as of 11 May 2026). Event-timing forecasts (60 events ~2023–24, 80 events ~end-2024) from earlier SELLAS guidance.
- Modelling: back-calculation and log-rank power (Schoenfeld) computed in this analysis; full methods and caveats in the accompanying modelling note. All reconstructed quantities are conditional on the stated assumptions.